Snow Accumulation In The Charts For Friday
Page created on: 2025-01-07 18:00:22
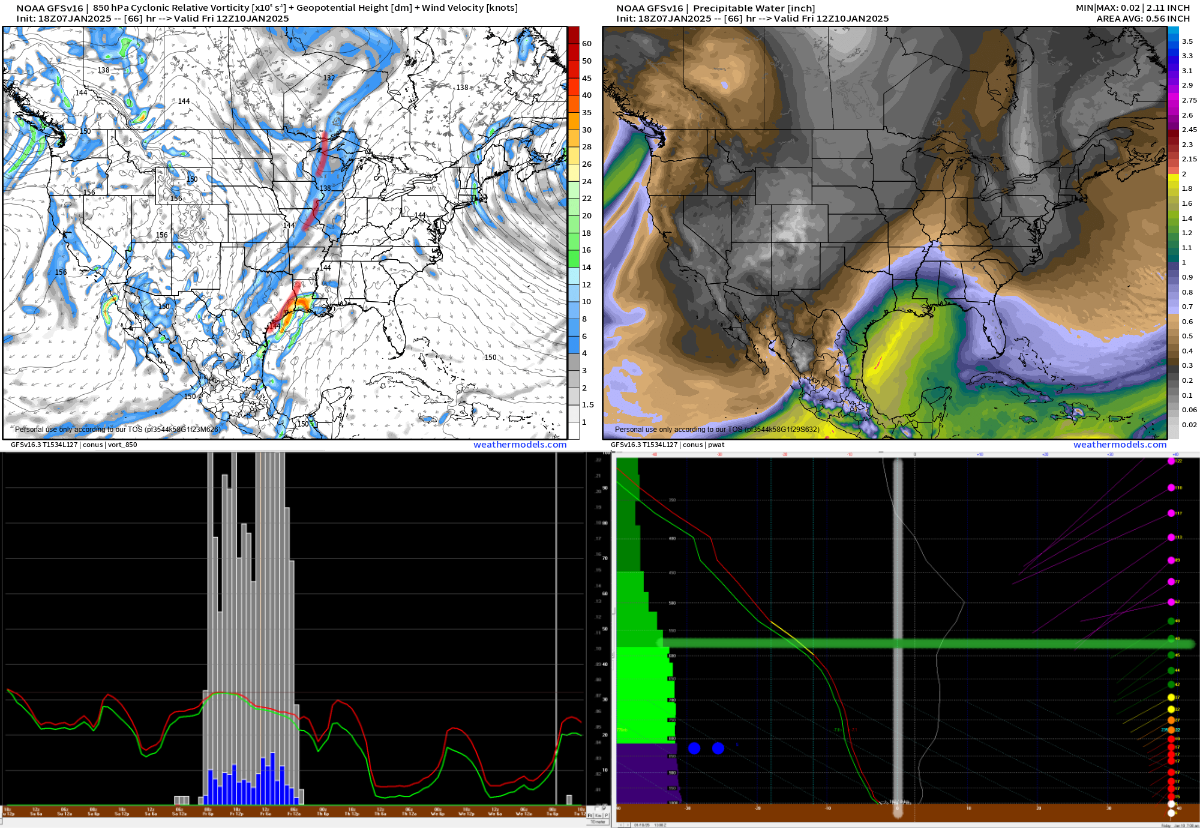
Friday weather event is very different in many ways from recent ice storm but already showing enough consistency to start to make some reads. Data analyzed in this discussion is time locked to Friday morning around sunrise except for the bottom left panel which is a time cross section.
Light snow is probable and accumulation is likely.
Analyzing what is in the charts starts with lift and shear displayed in the upper left chart. 3 waves, 2 weak north of but in sync with the main energy on the Gulf coast. This will likely be a dandy of a winter storm south of us but I FOCUS on home and let other forecasters handle their areas. 3 waves are tilted forward suggesting a cold storm but not as strong lift as the previous storm which was tilted back. I am saving you from some deep science hoping you will give me the latitude to just say tilted forward is less dynamic lift and shear but lift and shear.
3 waves, strongest south of here but that wave will enhance the flow off the GOM and push moisture this way. Top right panel displays the moisture plume. I should maybe have used a different version to enhance the numbers but it still displays the moisture making here enabling clouds and precipitation.
Moving around the clock, the bottom right panel shows so much. I only need this panel to analyze the event and say snow. Freezing line is highlighted just like for the ice events except in this chart the red temperature line is below freezing from the surface all the way to the top of the chart around 30,000'. Green line is dew point temperature and when red and green are together it is a saturated level. This charts suggests the entire stack of the atmosphere is saturated. Clouds at every level. The yellow highlight on the red line is the DGZ or the layer where snow flake crystals are created if there is sufficient moisture. There is in this chart. Saturated all below this layer means snowflakes can make it to the ground and should not sublimate. The green horizontal line is at that level and I drew it over to highlight the strong winds at that layer from the SW producing a moisture conveyor helping to bring the GOM moisture into the energy. Above that the influence of a strong jet stream is displayed with the very strong winds at the top of the atmosphere. This helps to create a flue effect and aid the lift.
Bottom left panel displays the period of projected snow which in this run starts as very light snow just after midnight Friday morning and continues with light snow every hour until just after sunset. My experience tells me that we almost never see 18 hours of continuous snow and if we do it accumulates more than 2". This run suggests 3-4" and the QPF (quantitative forecast) number runs in the .3-.4" of liquid which equates to the same amount. Maximum temperature projection here is right at 32.
Friend Kyle says there is a lot of gibberish in my discussions so I will try to always post a conclusion for those that want to skip to the end. I tend to read the conclusion of a scientific report before I read the body. I understand.
Analysis of this data results in a call for 2-4" of snow on Friday. My gut tells me to lean to the 2" solution and my practical side says the difference in 2" and 4" of snow is scorekeeping, the impact and reaction will be similar.
Look for snow on the ground Friday.