February Wet Start In Charts
Page created on: 2025-01-26 06:50:09
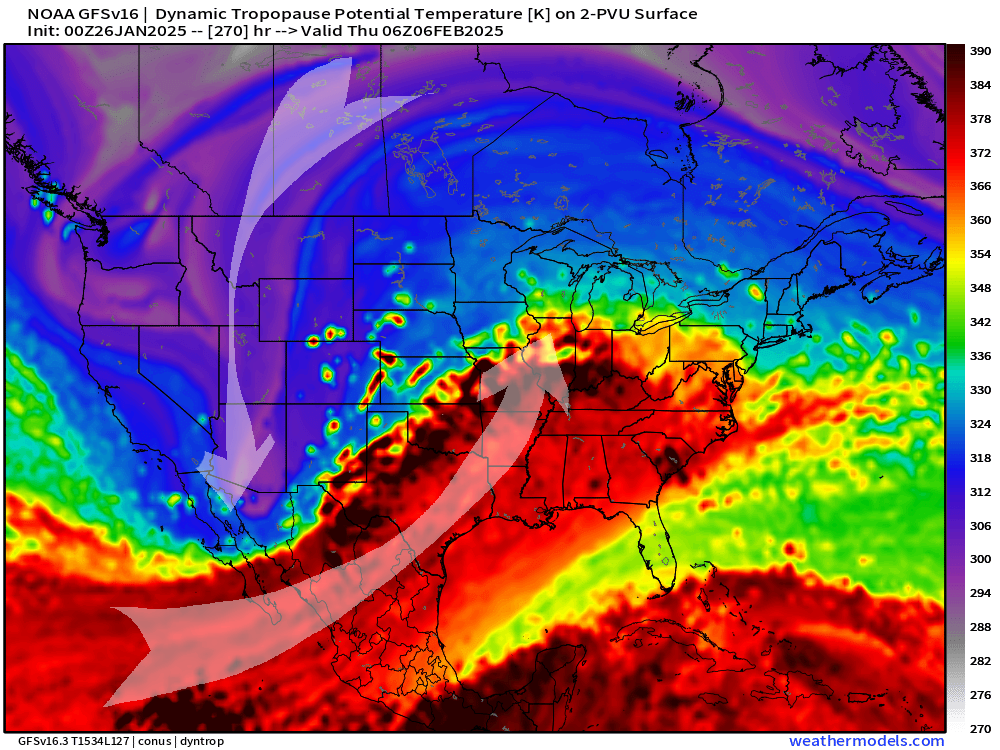
Timing is moving around in data a bit but forest level look is still the same, a wet start to February is in the charts. Map presented looking at source air masses to identify local influences and it displays large cyclonic flow to push cold dry air into SW US and established SW flow to push relative warm moist air into Lower Ohio River Valley. This chart is focused around Feb5 to Feb6 but other wet waves appear in recent runs near Feb1 and Feb 7. Logical solution is one main wave to bring bulk of rain in one of the events with lighter totals from others but bottom line numbers continue to suggest first 7-10 days of February could see a month's worth of rain.
Summary: projected rain totals for the first 7 days of rain suggest a very wet period with seasonably mild temperatures keeping focus on rain not snow.